Performance Measurement and Management
Diomidis Spinellis
Department of Management Science and Technology
Athens University of Economics and Business
Athens, Greece
dds@aueb.gr
Program States
- Directly executing code (user time)
- The kernel executes code on behalf of the program (system time)
- Waiting for an external operation to complete (idle time)
Also
- Real or clock time
- CPU time
Measuring Workload
- For terminating processes use the time command
$ time make
[...]
real    0m9.380s
user    0m2.580s
sys     0m6.640s
- For servers use top
 22:14:03 up  5:22,  2 users,  load average: 0.00, 0.01, 0.00
39 processes: 38 sleeping, 1 running, 0 zombie, 0 stopped
CPU states:   0.1% user,   0.4% system,   0.0% nice,  99.5% idle
Workload and Tools
| Profile |
r >>u+s |
s >u |
u ≈ r |
|---|
| Characterization |
I/O-bound |
kernel-bound |
CPU-bound |
|---|
| Tools |
Disk, net, VM stats, packet dumps |
System call tracing |
Function profiling, basic block counting |
|---|
System Monitoring Tools
- I/O
- iostat (under *BSD), vmstat (Linux)
- Memory
- vmstat, free (Linux)
- Network
- netstat
Example: virtual memory statistics while executing the find command
$ vmstat 1
   procs                      memory    swap          io     system         cpu
 r  b  w   swpd   free   buff  cache  si  so    bi    bo   in    cs  us  sy  id
 1  0  0      0  52296   3476  50092   0   0   340     0  189   190   0   6  94
 0  1  0      0  51736   3588  50428   0   0   448     0  214   243   0   5  95
 1  0  0      0  51072   3716  50724   0   0   424     0  210   218   0   5  95
 0  1  0      0  50596   3848  50968   0   0   376     0  196   204   0   4  96
 1  0  0      0  49952   3976  51304   0   0   464     0  220   247   0   6  94
 0  1  0      0  49556   4068  51512   0   0   300     0  177   172   2   2  96
 1  0  0      0  49024   4132  51816   0   0   368     0  196   195   0   7  93
 1  0  0      0  48228   4200  52416   0   0   668     0  270   307   0   9  91
 1  0  0      0  47668   4352  52712   0   0   448     0  215   227   0   5  95
 1  0  0      0  47048   4412  53092   0   0   440     0  213   244   1   5  94
 0  1  0      0  44912   4668  54080   0   0   432     0  211   225   0   4  96
Profiling System Calls
- The strace -c flag counts calls and reports time
- The results typically follow a Pareto distribution
Example:
$ strace -c find . -name test
% time     seconds  usecs/call     calls    errors syscall
------ ----------- ----------- --------- --------- ----------------
 66.06    0.367503         584       629           getdents64
 26.31    0.146389          80      1826           lstat64
  2.27    0.012621          40       313           fcntl64
  1.83    0.010168          31       326        10 open
  1.78    0.009894          16       625           chdir
  1.23    0.006846          22       316           fstat64
[...]
Function Profiling
- Statistical (prof)
- Graph-based (gprof, Java)
- Pinpoint hotspots
Profiling C/C++ Code with Gprof
- Compile with gcc -pg
- Execute program; a file gmon.out will be produced
- The gprof program produces the report
A Flat Profile
Flat profile:
Each sample counts as 0.01 seconds.
% cumulative self self total
time seconds seconds calls ms/call ms/call name
6.35 0.33 0.33 _Unwind_SjLj_Register
5.77 0.63 0.30 10192020 0.00 0.00 __gnu_norm::__deque_buf_size(unsigned int)
1.54 1.53 0.08 10 8.00 118.33 parse_parse()
1.35 1.60 0.07 5096343 0.00 0.00 operator==(Tokid, Tokid)
A Call Graph Profile
index % time self children called name
10 Pdtoken::process_pragma() <cycle 1> [360]
[4] 22.8 0.08 1.10 10 parse_parse() <cycle 1> [4]
0.00 0.42 8348/17593 Token::unify(Token const&, Token const&) [5]
0.00 0.26 4328/4328 Type::declare() [28]
0.00 0.22 3511/3511 completed_typedef(Type) [33]
0.00 0.03 3529/3540 Block::enter() [220]
0.00 0.02 7402/27543 obj_lookup(std::string const&) [94]
0.00 0.02 812361/834736 YYSTYPE::operator=(YYSTYPE const&) [324]
0.01 0.01 85359/295237 Type::~Type() <cycle 3> [429]
0.00 0.02 1690/1690 Call::register_call(Token const&, Id const*) [331]
0.00 0.02 11362/11362 Type::set_abstract(Type) <cycle 4> [581]
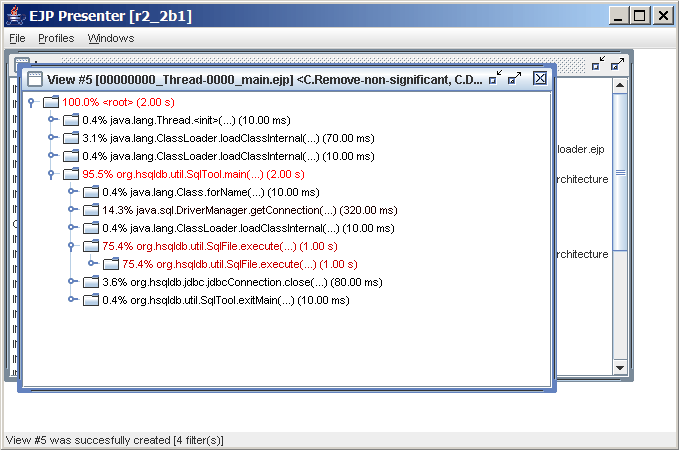
Profiling Java Code with EJP
- Add the tracer library to your library path
- Run program under the Java VM with -Xruntracer
- View the results with the EJP Presenter
A Java Program Profile
Basic Block Counting in C/C++ Code
To investigate algorithms count the number of times each line is executed.
- Compile with gcc -pg -g -fprofile-arcs -ftest-coverage
- Execute program; a file name.bb will be created
- Run gcov -l name.bb
- A .gcov file for each source file will be created
Example:
main(int argc, char *argv[])
{
1 int i, j, k;
1 int a = 0;
11 for (i = 0; i < 10; i++)
110 for (j = 0; j < 10; j++)
1100 for (k = 0; k < 10; k++)
1000 a += i + j + k;
1 }
Architectural Inefficiencies
- Cache misses
- Branch mispredicts
- Front end stalls (failure to deliver enough instructions)
- Cache pollution through address aliasing (set associativity issues)
- Long latency instructions
- TLB misses
Architectural Profiling Tools
- Processor event monitoring
- Oprofile (http://oprofile.sourceforge.net/) (Linux)
- Locality optimizations
- SLO: Suggestions for Locality Optimizations (http://slo.sourceforge.net/)
Events that Oprofile can analyze on a Core 2 Intel CPU.
- Clock cycles when not halted
- number of instructions retired
- number of L2 cache requests
- L2 cache demand requests from this core
- Page table walk events
- cycles divider is busy
- L1 cacheable data read operations
- Bus cycles when data is sent on the bus
- number of instruction fetch misses
- Branch predicted taken with bubble 1
- [100 more]
Memory Performance
Memory as important as CPU cycles
- Difference in latency between memory types
- Large data sets
- Embedded applications
- Bandwidth requirements
Again, we need to profile
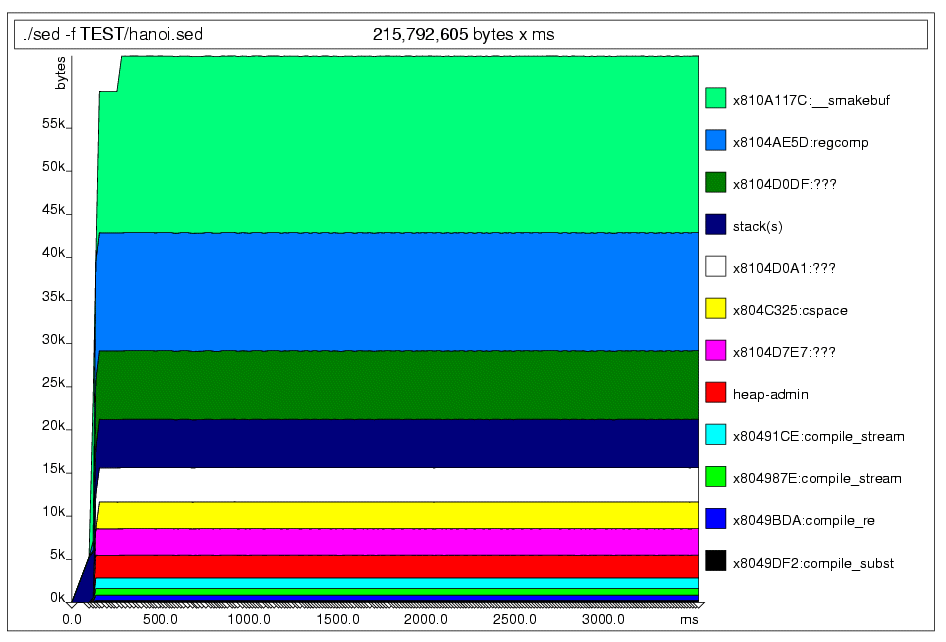
Memory Profiling C/C++ Code with Valgrind
- Create a debug build (-g)
- Run the program under valgrind
- Examine valgrind's output
- Can also detect memory leaks
Example: sed under valgrind
echo ':abcdefgh: : :' |
valgrind --tool=massif ./sed -f TEST/hanoi.sed
 Last change: Sunday, December 6, 2009 8:13 pm