Inspection and Testing
Diomidis Spinellis
Department of Management Science and Technology
Athens University of Economics and Business
Athens, Greece
dds@aueb.gr
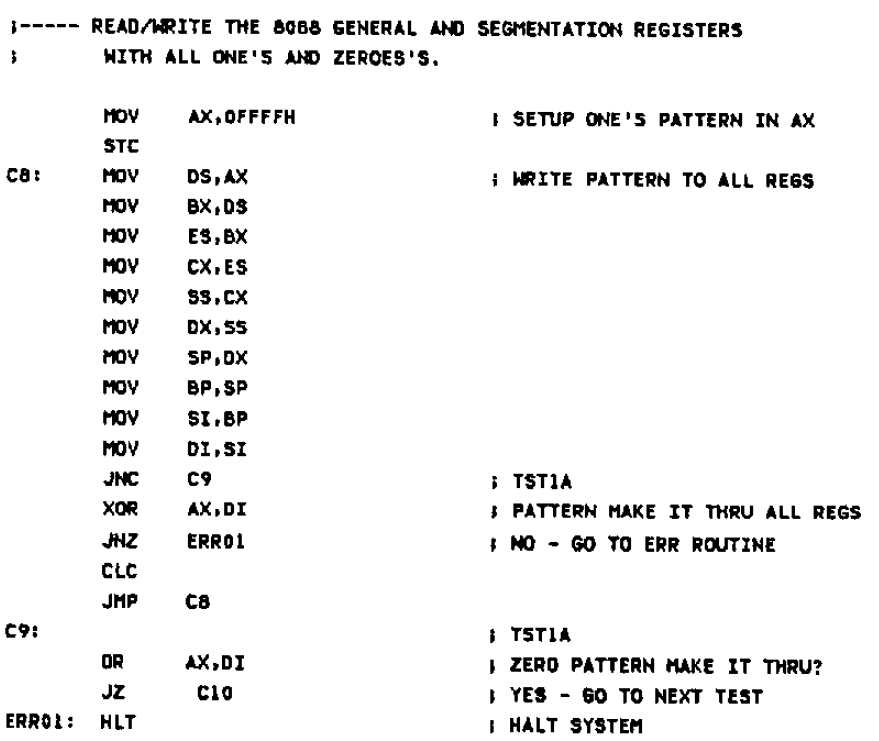
Example: Processor Testing
Intel 8088 processor register test routine from IBM's 1981 PC BIOS.
The carry flag is used as the loop index.
Static Verification
Examples:
Characteristics:
- Detection of common errors
- Various levels of inference
- False positives and negatives
Identified Issues
- Possible bugs
- Portability problems (C/C++)
- Function return values (C/C++)
- Dead code
- Overcomplicated expressions
- Suboptimal code
- Duplicate code
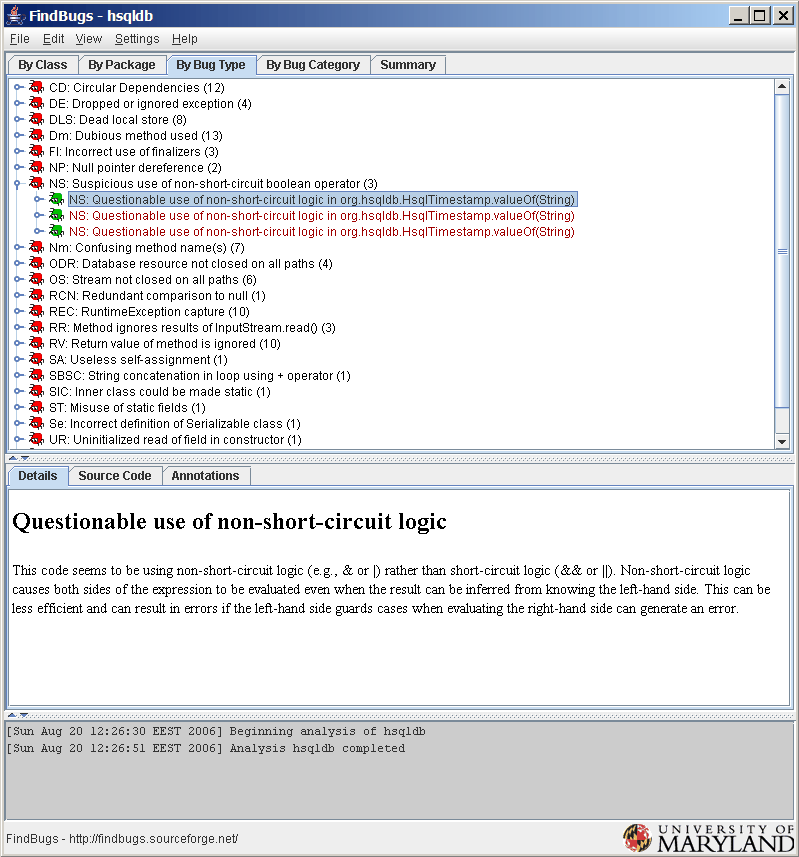
Some FindBugs Issues
(FindBugs reports more than 200 issues.)
- An apparent infinite recursive loop.
- A container is added to itself.
- A volatile reference to an array doesn't treat the array elements as volatile
- Usage of GetResource may be unsafe if class is extended
- Creates an empty jar file entry
- Dubious catching of IllegalMonitorStateException
- Method performs math using floating point precision
- Class implements Cloneable but does not define or use clone method
- clone method does not call super.clone()
- Method might drop exception
- Method might ignore exception
- Method invokes dubious new String(String) constructor; just use the argument
- Method invokes dubious new String() constructor; just use ""
A FindBugs Run
GCC Best Practices
- Compile C/C++ with all warnings enabled (gcc -Wall)
- When warnings are enabled, alse enable optimization (gcc -O)
- Treat warnings as errors (gcc -Werror)
- Compile a debug version of C++ code defining -D_GLIBCXX_DEBUG -D_GLIBCXX_DEBUG_PEDANTIC
- Annotate printf-like functions. Example:
extern void argp_error (__const struct argp_state *__restrict __state,
__const char *__restrict __fmt, ...)
__attribute__ ((__format__ (__printf__, 2, 3)));
(Other formats include scanf, wprintf, wscanf).
C Compilation Example
main(char *argv[])
{
int a, b, c;
a = b;
printf("%g\n", a);
}
Plain compile:
$ gcc t.c
$
Compile with warnings:
$ gcc -O4 -Wall -Werror t.c
cc1: warnings being treated as errors
t.c:9: warning: return-type defaults to `int'
t.c:9: warning: first argument of `main' should be `int'
t.c:9: warning: `main' takes only zero or two arguments
t.c: In function `main':
t.c:13: warning: implicit declaration of function `printf'
t.c:13: warning: double format, different type arg (arg 2)
t.c:10: warning: unused variable `c'
t.c:14: warning: control reaches end of non-void function
t.c:10: warning: `b' might be used uninitialized in this function
Lint Best Practices
- Include a lint pass in your build
- Comment case statements lacking a break with FALLTHROUGH
- Comment uneachable code (exit, longmp) with NOTREACHED
- Comment functions taking format arguments with PRINTFLIKE, SCANFLIKE
- Sparingly use #ifndef lint to silence lint warnings
Tracing Tools
| Interface | Tool |
|---|
| Operating System | strace |
| Library | ltrace |
| Network | tcpdump |
| Resource Snapshot | lsof |
Using Tracing Tools
- Locate bugs without using the source code
- Explain an application's behavior
- Determine undocumented features
- Discover appropriate APIs
- Locate performance bottlenecks
[sl]trace Tips and Tricks
- Trace running processes using the -p flag
- Send output to a file using the -o flag
- Read complete strings using a large argument (e.g. 1024) to -s
- Trace forked processes with the -f flag
Example: System Call Tracing
Which shared libraries is dot loading?
$ strace dot </dev/null 2>&1 | fgrep .so | fgrep -v ENOENT
open("/etc/ld.so.cache", O_RDONLY)      = 3
open("/usr/lib/libfreetype.so.6", O_RDONLY) = 3
open("/usr/lib/libpng.so.2", O_RDONLY)  = 3
open("/usr/lib/libjpeg.so.62", O_RDONLY) = 3
open("/usr/lib/libz.so.1", O_RDONLY)    = 3
open("/lib/libm.so.6", O_RDONLY)        = 3
open("/lib/libc.so.6", O_RDONLY)        = 3
Example: Library Call Tracing
How does the whoami command obtain its data?
$ ltrace whoami
[...]
geteuid()                                         = 1000
getpwuid(1000, 0x40013678, 0xbffffcac, 0x08048cff, 0x4012ee48) = 0x401310f0
puts("dds"dds
)                                       = 4
exit(0 <unfinished ...>
Unit Testing
- JUnit (http://www.junit.org/) and its friends is the name of the game
- Based on test classes
- Test class contains method annotated
@Before
- Test methods are annotated with
@Test
- Test methods call
assertTrue
- main calls
junit.textui.TestRunner.run(TestClass.class)
JUnit Example
Test Class and Fields
public class RationalTest {
private Rational r12;
private Rational r13;
private Rational r56;
}
Initialization Code
@Before public void setUp() {
r12 = new Rational(1, 2);
r13 = new Rational(1, 3);
r56 = new Rational(5, 6);
}
A Test Method
@Test public void simpleAdd() {
Rational result = r12.add(r13);
assertTrue(result.equals(r56));
}
Run the Class's Test Methods
public static void main (String... args) {
junit.textui.TestRunner.run(RationalTest.class);
}
Textual Regression Testing
- Used for batch oriented applications
- A loop goes over the input files
- Each input file creates a new output file
- Output file compared with correct file
- A "priming" mode allows the creation of the correct files
Example: Testing the Sort Program
#!/bin/sh
FILES=`cd input; echo *`
# Prime test data
if [ "$1" = "-p" ] ; then
for i in $FILES ; do
sort input/$i >old/$i
done
fi
# Compare old with new result
for i in $FILES ; do
sort input/$i >new/$i
if diff old/$i new/$i ; then
echo "OK $i"
else
echo "FAIL $i"
exit 1
fi
done
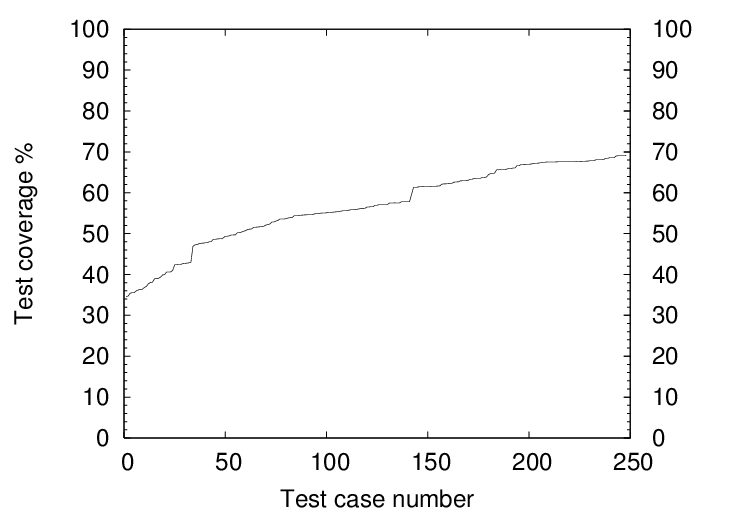
Test Coverage in C/C++ Code
To investigate test coverage, you can use basic block profiling.
- Compile with gcc -pg -g -fprofile-arcs -ftest-coverage
- Execute program; a file name.bb will be created
- Run gcov -n name.bb
- You will get a report of how many lines were executed
- Numbers less than 100% indicate a lack of coverage
Example:
83.33% of 650 source lines executed in file hilbert.c
Example: Test coverage of Perl's source code versus the number of executed test cases
Further Reading
- Kent Beck and Erich
Gamma.
Test infected: Programmers love writing tests.
Java Report, 3(7):37–50, July 1998.
- David Hovemeyer and
William Pugh.
Finding bugs is easy.
ACM SIGPLAN Notices, 39(12):92–106, December 2004.
OOPSLA 2004 Onward! Track.
- Institute of Electrical and Electronics Engineers.
IEEE Standard for Software Unit Testing.
IEEE, New York, 1987.
IEEE Standard 1008-1987.
- Richard McDougall, Jim
Mauro, and Brendan Gregg.
Solaris
Performance and Tools: DTrace and MDB Techniques for Solaris 10 and
OpenSolaris.
Prentice Hall PTR, Upper Saddle River, 2006.
- Diomidis Spinellis.
I
spy.
IEEE Software, 24(2):16–17, March/April 2007.
(doi:10.1109/MS.2007.43 (http://dx.doi.org/10.1109/MS.2007.43))
 Last change: Monday, June 11, 2012 12:07 am