Organizational Adoption of Open Source Software
Diomidis Spinellis,a Vaggelis Giannikasa, b
a Department Management Science and Technology, Athens University of Economics and Business, Patision 76, GR-104 34 Athens, Greeceb Institute for Manufacturing, University of Cambridge, 17 Charles Babbage Road, Cambridge CB3 0FS, United Kingdom
Abstract
Organizations and individuals can use open source software (OSS) for free, they can study its internal workings, and they can even fix it or modify it to make it suit their particular needs. These attributes make OSS an enticing technological choice for a company. Unfortunately, because most enterprises view technology as a proprietary differentiating element of their operation, little is known about the extent of OSS adoption in industry and the key drivers behind adoption decisions. In this article we examine factors and behaviors associated with the adoption of OSS and provide empirical findings through data gathered from the US Fortune-1000 companies. The data come from each company's web browsing and serving activities, gathered by sifting through more than 278 million web server log records and analyzing the results of thousands of network probes. We show that the adoption of OSS in large US companies is significant and is increasing over time through a low-churn transition, advancing from applications to platforms. Its adoption is a pragmatic decision influenced by network effects. It is likelier in larger organizations and those with many less productive employees, and is associated with IT and knowledge-intensive work and operating efficiencies. Keywords: open source software; technology adoption; industrial practice1 Introduction
Thousands of volunteers and numerous companies develop, distribute, and license software in a way that allows others to freely use it, study it, modify it, and redistribute it. What are the prospects of the organizational adoption of this so-called open source software (OSS) and why should we care? In this paper, through a novel application of web server log scanning and host fingerprinting techniques, we gather evidence of OSS adoption among the US Fortune-1000 companies, and use it to examine factors associated with OSS adoption. Our observations are statistically significant and span a wide sample of companies. However, although each research question we test is backed by existing theories, we freely admit that our study as a whole is data-driven rather than grounded on a single cohesive theoretical framework. Our main contributions are: a) findings that theoretical frameworks of organizational OSS adoption could build upon and should be able to explain, and b) the description and demonstration of powerful internet-based methods for collecting data about an organization's IT operations. A commonly accepted OSS definition [Coar, 2006] specifies that complying software must be licensed for free redistribution (at no cost or for profit), must provide access to its source code, should allow the creation of derived works provided they respect the creation of the original author, and should not restrict the use of the software with reference to specific persons, groups, fields of endeavor, products, technologies, or other software. Well-known examples of open source software include the Linux operating system kernel, the Mozilla Firefox web browser, the OpenOffice.org office application suite, the MySQL relational database system, and the PHP programming language. Many OSS products offer plausible alternatives to the corresponding proprietary products, while some, like the the Apache web server, the Sendmail mail server, and the BIND domain name system server, are market leaders in their categories [Netcraft Ltd, 2009,E-Soft Inc, 2007,Simpson and Bekman, 2007,Kerner, 2007]. With its roots in the academic world OSS was initially viewed with suspicion by some companies. As a representative example, Microsoft openly attacked it citing problems related to version incompatibilities, intellectual property risks (especially in the context of copyleft licenses), lack of a credible business model, and an inability to fund innovation [Mundie, 2001,The Economist, ]. However, other IT companies have embraced it for operational or strategic reasons. One example of operational use involves Google's thousands of servers, which work on a modified version of Linux, thus benefiting the company through the system's low cost and the ability to modify it to suit its needs [Weber, 2005,p. 6]. As another example consider Apple, which has used OSS code from the Mach and FreeBSD operating systems to leapfrog in the development of its widely-acclaimed Mac OS X operating system [West, 2003]. On the strategic front, IBM has built a large community of developers and potential clients around the open source Eclipse integrated software development environment [Gamma and Beck, 2004], while Sun-before becoming part of Oracle-created a huge (though commercially underutilized) mindshare among programmers and system administrators with the open-sourcing of its Java platform and Solaris operating system [Goldman and Gabriel, 2005]. Proponents of open source software advance various arguments regarding the benefits of its adoption [West and Dedrick, 2001,Wheeler, 2007,Ven and Verelst, 2006] - see Section 2.1. There is also considerable anecdotal evidence on the use of OSS in non IT companies (see references in Section 2.3). However, theories and arguments on the adoption of OSS are seldom substantiated by empirical data, and the available data are patchy, difficult to replicate and quantify, and unsuitable for deriving generally useful theories and prescriptive results. To address these problems we analyze factors associated with the adoption of OSS (Section 3) and validate them empirically through the analysis of data collected for the US Fortune-1000 companies (Section 5). The data come from each company's web browsing and serving activities, gathered by sifting through more than 278 million web server log records and analyzing the results of thousands of network probes (Section 4). There are several reasons motivating our study. First, patterns of OSS adoption in the Fortune-1000 companies reveal best practices, challenges, and opportunities that may be applicable to other organizations. Given the role of knowledge barriers in technology diffusion [Attewell, 1992], our findings outline the role of an ecosystem that can lower them. In addition, the software industry forms a vital and important part of the US economy [Rubin et al., 2002]. The emergence of OSS is likely to form a disruptive change. Therefore, companies developing proprietary software can study OSS adoption patterns to best determine how to adjust their business models. Moreover, the agile end-user and volunteer-driven practices used for developing open source software differ markedly from the more rigid processes often followed in the development of proprietary software. Thus, the commercial adoption of products developed under the OSS model can be a precursor to wider changes on how many other products are developed and marketed [von Hippel, 1998,von Hippel, 2001]. Finally, for-profit and volunteer OSS development organizations can study the way their products are adopted in order to optimize their offerings and their dissemination strategies.2 Related Work
Theories and empirical data related to this article fall roughly into four fields: organizational adoption of IT innovation, research on the adoption of OSS by organizations, studies of OSS adoption at an aggregate level, and reports on specific cases of OSS use. We examine work related to this paper's specific research questions and in particular the organizational adoption of IT innovation in Section 3.2.1 OSS Adoption by Organizations
For the choice of software that fits best an organization's needs Wang and Wang [2001] proposed criteria for a product-oriented evaluation framework. They used this framework to compare open source systems, arguing that most of the criteria one must consider when choosing an OSS are common with those of proprietary software selection. Searching why and how enterprises adopt open source Dedrick and West [2003], based on a series of interviews with MIS managers, developed a grounded theory of open source platform adoption. They classified the inherent factors they found into five categories: the willingness to take risks on a new and unproven technology, the need for organizational slack to evaluate the new technology and to self-support unsponsored technologies, the low cost of open source software, the inherent trialability of "free" software distributed on the internet, and the availability of external sources of support and expertise. An important contribution of this study is the suggestion for researchers to study the innovation adoption decision separately from the issues associated with switching between standards. This advice was coincidentally followed by Glynn et al. [2005] who investigated a case of large-scale OSS adoption in a specific organization. Significant factors proved to be: the possibility of collaborating in a reciprocal fashion with the OSS community, the awareness of other organizations that were adopting OSS, cost, the availability of OSS-literate personnel, and the ability to modify and access the source code. Research around benefits and significant factors driving OSS adoption, has led to the conclusion that the most important reason of choosing open source is purchasing cost and the total cost of ownership [Forrester, 2008]. Although other benefits like stability and performance [Berlecon Research, 2002], flexibility and control [The Dravis Group, 2003], external support [Ven and Verelst, 2006] and security [Walli et al., 2005] are also stressed in the advantages listed by open source adopters, it seems that total cost of ownership and lower acquisition cost are the most significant ones. On the other hand, there are also many factors that operate as barriers toward the organizational adoption of OSS. Among them the most important ones seem to be knowledge barriers, integration with legacy applications, uncertainties introduced by forking, sunk costs, and technological immaturity [Nagy et al., 2010].2.2 Aggregate Studies of OSS Adoption
Numerous studies examine OSS adoption across whole regions, industries, or application domains. More detailed presentations of such work can be found in a survey conducted by UNU-MERIT [2006], Wheeler's 2007 article on the reasons of choosing OSS, and recent work on the dynamics of the OSS community [Deshpande and Riehle, 2008]. In brief, studies agree that web and database servers are the most common types of OSS used. According to Unisphere Research [2006] 71% of Linux users chose it to host their web servers and 65% for their databases. Examining the adoption of web servers, evidence suggests that open source is the most popular choice, mainly because of the Apache web server with its adoption showing a rising trend during the last 15 years [Netcraft Ltd, 2009,E-Soft Inc., 2009]. Examining the use of open source operating systems, studies have reported that OSS adoption on servers is markedly higher than on PCs and workstations. Specifically, Netcraft Ltd [2001] found that 45% of operating systems used by computers running public internet web sites was open source, just 4.5 percentage points below Microsoft's share. Gradually the adoption of OSS is moving beyond the server market extending along the entire software and application stack. Forrester [2008], in a study of companies using OSS for experimental projects or prototyping on a group level, found that 62% used OSS desktop applications and 71% OSS programming languages. Finally, on the sectoral distribution of OSS adoption two studies report that firms in the telecommunications sector are the ones most likely to adopt OSS [Walli et al., 2005,IDC, 2005], while several surveys indicate the importance of a firm's size in OSS adoption [Walli et al., 2005,Unisphere Research, 2006]. These last two findings are examined and discussed later in our paper.2.3 Specific Cases of OSS Adoption
We searched existing publications looking for specific cases of OSS adoption categorizing them according to the applications used, the organization in which they were used, and the reasons cited for choosing OSS.1 We found relatively few studies and even fewer containing enough details in all three areas. It is therefore not prudent to derive reliable conclusions from the sum of these studies. From the studies we examined, 17 organizations used OSS for providing back-office functionality, two for sales support, eight in their R&D activities, and more than 30 for unspecified purposes. Reasons cited for choosing OSS include lower cost [Voth, 2003,Proctor et al., 2003,Searls, 2004,Fitzgerald and Kenny, 2004,Rossi et al., 2005,Matthews et al., 2008], lower hardware cost (IDC, 2001a,Geiszler et al., 2004; Woods and Guliani, 2005,p. 85), software features [IDC, 2001b,Yang and Jiang, 2007,Matthews et al., 2008], lower total cost of ownership [Gupta et al., 2008], quick deployment [Searls, 2003], portability across platforms [Voth, 2003], avoidance of formal procurement and commercial license management [Voth, 2003], and customizability [Proctor et al., 2003].3 Theory and Research Questions
Before posing our research questions we must set straight our terminology: the meaning of OSS adoption and its relationship to its actual use. A thorny issue in the diffusion of innovation studies are adoption's so-called assimilation gaps, which in the case of information systems are observed as the difference between an information system's acquisition and its productive deployment [Fichman and Kemerer, 1999]. Gallivan [2001] made a similar observation by distinguishing between primary adoption where management decides that a particular information system is required cover a perceived need, and secondary adoption where the organization integrates the information system at an operational level. This happens through a process of assimilation, which advances through the stages of initiation, adoption, adaptation, acceptance, routinization, and infusion. In the case of OSS, acquisition is a lightweight process, which may simply consist of downloading the software, perhaps after clearing licensing issues with the organization's internal-control department. Furthermore, the data we collected provide evidence of actual use in the case of the web server and its underlying operating system, while the policies of the organizations we study make it unlikely that observations of OSS use on the client side are isolated occurrences (see Section 4). Therefore, in our study we employ the term adoption to denote small to full scale deployment and actual use.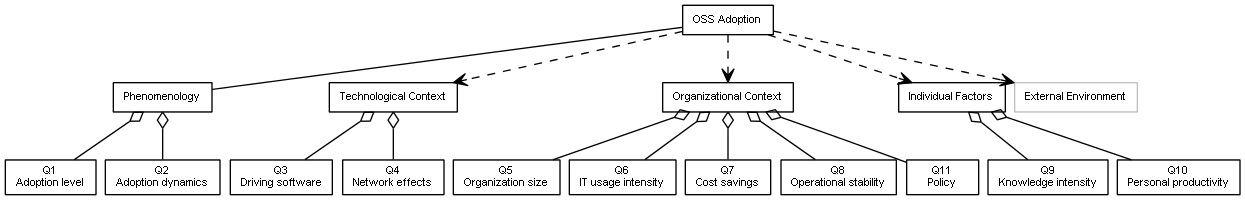
Figure 1:
The research questions mapped on the theoretical framework by Glynn et al. [2005].
There are many questions that an empirical study on the adoption of
OSS can help answer.
We start by looking at the industry-wide dynamics of OSS adoption,
continue by focusing on individual companies, and
finish by examining some interesting people-related aspects.
The research questions of our study
neatly match the three of the four macro-factors identified by Glynn et al. [2005];
see Figure 1.
Two questions, Q1 and Q2, are of a phenomenological nature,
examining the current status and outlook of OSS adoption.
From the research framework we use as a basis,
we investigate some of the possible
technological factors through questions Q3, Q4,
organizational factors through Q5, Q6, Q7, Q8, Q11, and
individual factors through Q9, Q10.
Although Q4 helps us investigate inter-environmental
factors, unfortunately, we lack data to investigate factors of the
external environment.
One might be tempted to map the five critical factors
proposed for determining the use of agile or plan-driver development methods
to those applicable for choosing to use OSS.
There are certainly some parallels between the factors and our questions:
size (Q5),
criticality (Q9),
dynamism (Q8),
personnel (Q10),
culture (Q11).
However, given that there is no reason to think that the choice
of OSS somehow relates to agility, we chose not to pursue this angle.
There are also other studies on OSS and its adoption.
A number of them propose reasons for a company
to adopt software development techniques
used by OSS projects [Boehm and Turner, 2004] or
to participate in the development of an OSS project [Feller and Fitzgerald, 2001].
The reasons proposed are however not directly applicable to our research
questions.
Moreover, although the adoption of information systems
and software applications has been examined in depth
- Jeyaraj et al. [2006] provide a comprehensive review of several proposed theories
-
we believe that the particular characteristics of OSS
and the type of data we collected benefit from using
the more specialized framework presented in Figure 1.
Research Question 1 What is the level of OSS adoption in large US companies?
The quantitative OSS adoption indicators we presented in Section 2.2 show that OSS has long passed the market introduction stage but has not yet reached the maturity stage. In fact, an analytical study has proved that by following appropriate strategic decisions open source and proprietary software can coexist in a duopoly [Casadesus-Masanell and Ghemawat, 2006]. We therefore believe that OSS is a mainstream product alternative currently in the growth phase. Research Question 2 What are the dynamics of OSS adoption by individual companies?
An important question associated with the dynamics of OSS adoption is the behavior of individual organizations across time. Are organizations dipping their feet in the water only to retreat from OSS after receiving a cold shower, or are they satisfied by its benefits and increase the areas in which they adopt it? Marketing practitioners use the term churn rate to describe the number of customers entering and leaving their pool. Similar measures are customer turnover, defection, and attrition rates. In our case a high churn rate-organizations adopting OSS in one year only to go back to proprietary software in a next one-would indicate problems in the technology's adoption, even in the face of an increasing overall adoption rate. In contrast, an increasing scope of OSS products used might indicate that the organization is happy with OSS and seeks to expand its perceived benefits to other areas. The two main factors that might impede a company's replacement of proprietary systems with OSS ones of equivalent functionality are switching costs [von Weizsacker, 1984,Brynjolfsson, 1993,Bessen, 2002] and customer loyalty [Dick and Basu, 1994]. Once these considerable obstacles are overcome we would expect a stable flow of transitions prompted by the various benefits of OSS outlined in sections 2.1 and 2.3 and also presented in other studies [West and Dedrick, 2001,Wheeler, 2007]. Research Question 3 In what order is OSS adopted within a company?
Do companies adopting OSS work bottom-up from the operating system (which many consider a commodity) and progress to the more business-critical applications, or do they avoid the disruption of an operating system switch and instead test the waters in the application space? The main determinants here are the decomposition of software into applications and infrastructure [Messerschmitt and Szyperski, 2004,pp. 200-204], the advantages enjoyed by platform leaders [Cusumano, 2004,pp. 74-77], and the importance of network effects [Shapiro and Varian, 1999]. One argument is that pragmatic users want particular results from their IT infrastructure (for instance, obtaining or serving web pages). These can often be provided by an OSS application, and this scenario can be easily tested by deploying such applications on the existing operating system. Once an OSS application is installed and proves its value, the underlying operating system can also be switched to an open source one, because the proprietary application that required a corresponding operating system has been removed. This mode of adoption minimizes the drag of earlier technology on IT adoption [Fichman and Kemerer, 1993], and at the same time builds on the learning effects that may arise from the earlier use of a technology [Stoneman, 1981]. Other factors affecting the order of adoption include the risk associated with particular changes (critical real-time customer-serving systems, versus less-critical batch-oriented back-office operations), as well as the levels of trust the company places on various parts of an OSS ecosystem. Research Question 4 Is the selection of proprietary software or OSS subject to network effects?
In the preceding research question 3 we posit a particular technology-based adoption scenario. However, there may also be the case that that there are concrete network-specific advantages in using applications of a particular type (open source or proprietary). Several studies have examined the important effect of network externalities in a technology's adoption using both theoretical methods [Katz and Shapiro, 1986,Katz and Shapiro, 1994,Economides and Katsamakas, 2006] and empirical findings [Saloner and Shepard, 1995,Majumdar and Venkataraman, 1998,Gowrisankaran and Stavins, 2004]. Intra-organizational network effects (i.e. component selection interactions within a company's boundaries) associated with the adoption of OSS can be direct or indirect. The direct effects are associated with the prevalence of a particular product within the organization where it enjoys advantages over a competing product in the areas of IT support, software provision [Church and Gandal, 1992], and training. For instance, if all a company's PCs run Microsoft Windows, its IT administrators may find it easier to run the same system also on their servers. The indirect or two-sided network effects [Parker and Van Alstyne, 2005] are associated with the co-existence of different but complementary products, such as the operating system and the application running on it, or the web server and the corresponding browser. In this case, products of the same kind benefit through their superior interoperability, through the availability of bundled licenses and support contracts, and through the organization's contacts with (the typically segregated) support communities. This has been empirically validated for the case of web servers and browsers [Gallaugher and Wang, 2002]. As a concrete example, if a company writes its software using Microsoft's .NET development tools this will run reliably only the company's Windows systems. Based on the above description, we consider OSS and proprietary applications as two disjoined networks with interoperability challenges. Specifically, we examine whether a particular organization will try to use either OSS applications or proprietary ones, rather than mix the two kinds freely together. Research Question 5 How is an organization's size affecting the adoption of OSS?
Let us now switch our view from the dynamics of OSS adoption to the organizations adopting OSS. The relationship between a company's size and IT adoption can be viewed either from an IT management perspective [DeLone, 1981] or by looking at a company's organizational characteristics [Hannan and McDowell, 1984,Kelley and Helper, 1999]. For the majority of organizations we have studied, the advantages of open source software are in most cases relatively small and tactical rather than strategic. However, they are compounded over the total number of installations and the size of a company's IT operations [Cohen and Levinthal, 1989], perhaps through economies of scale and scope. As an example, a company with thousands of employees running only standardized web-based applications could easily switch their PCs to run Linux and the Firefox web browser. Although such a move in a large organization will entail large switching costs, these are proportional to the organization's resources and therefore these large costs should not derail the choice of switching to new software. Furthermore, studies have found that there is a positive relationship between organizational size, innovations, and their implementation [Damanpour, 1992], that large firms are more likely to adopt innovations before smaller ones [Davies, 1975,p. 118], that the establishment and firm sizes are positively related to ICT adoption [Bayo-Moriones and Lera-López, 2007], and that a firm's size also affects the availability of ICT-related skills [Morgan et al., 2006] and resources [Spanos et al., 2002], which are needed in a transition to OSS. Research Question 6 How is IT usage intensity affecting OSS adoption?
Another element of scale efficiencies is not associated with a company's size, but with the intensity of IT usage within it. The theoretical underpinning is the same as that of the preceding question 5, but the driver is a higher density of IT installations. Compounding factors in this case are experience with IT technology [Venkatesh et al., 2003,pp. 433-435, 447] and technical know-how [Attewell, 1992]. Thus, companies in fields with a high IT-usage intensity could be more likely to adopt OSS. Research Question 7 Is OSS adoption associated with financial operating efficiencies?
Numerous studies have examined the influence on a company's performance of technology policy and adoption in general [Tornatzky and Klein, 1982,Zahra and Covin, 1993,Stoneman and Kwon, 1996] and IT in particular [Brynjolfsson, 1993,Brynjolfsson and Yang, 1996,Stiroh, 2002,Carr, 2003]. On a first reading the results appear to be inconclusive. However, Hitt and Brynjolfsson in their classic 1996 paper used the theory of production and theories of competitive strategy to deduce that there is no inherent contradiction between increased productivity, increased consumer value, and unchanged business profitability. In many cases the direct cost of purchasing OSS and keeping it up to date is zero or very low. If this cost is reflected in an overall lower total cost of ownership it could lead to increased profits. However, given that IT costs are typically a relatively low percentage of a company's total expenditures, it is more likely that the causal relationship will be the other way round. Namely, profitable well-run companies may be adopting OSS as an additional appropriate practice for lowering the cost and increasing the efficiency of their operations. This view is further strengthened by studies arguing that firms for which an innovation is most profitable will become early adopters [von Hippel, 1988,Attewell, 1992]. Research Question 8 How is an organization's stability affecting OSS adoption?
As posited by Nolan [1973] and others who have built on his work [King and Kraemer, 1984] the introduction of information technologies in an organization proceeds in distinct stages. Therefore, it is likely that the introduction of a new technology, like OSS, will face obstacles that will depend on the company's state of IT growth. Furthermore, the company's growth stage may also be a significant factor in the adoption of innovation. However, the theoretical arguments for this are conflicting. Younger, growing firms may benefit through their flexibility [Christensen and Rosenbloom, 1995] as well as through lower adjustment costs and modern capital stock, while older, stable companies may profit from their technological experience [Dunne, 1994]. This conflict is also reflected in empirical studies: some report a positive relationship between an organization's age and its ability to innovate [Sorensen and Stuart, 2000] and others a negative one [Kimberly and Evanisko, 1981]. The introduction of OSS in an organization can be disruptive, and the evolution and maintenance of existing OSS installations trickier than comparable setups based on proprietary software. These problems can be less of an issue in a slower-growing, stable organization where change and therefore demands from IT staff are lower. Companies that are in a flux, as evidenced by increasing capital spending or sales, or high levels of debt, are more likely to minimize the risk of their IT operations [King et al., 1994,Fichman, 2000] by opting for proprietary solutions. In contrast, more stable companies that do not exhibit the previously mentioned characteristics may have established a culture for process improvements and have more appetite for IT risk and the ability to manage it effectively, and will therefore be more likely to adopt OSS. Research Question 9 How is an organization's human capital occupation affecting OSS adoption?
A number of studies examine the characteristics of new technology adopters [Davis, 1989,Thompson et al., 1991,Venkatesh et al., 2003]. The main causation factors include the judgment of one's ability to use technology - as modeled in the social cognitive theory of self-efficacy [Compeau and Higgins, 1995], the perceived relative advantage within the context of the innovation diffusion theory [Moore and Benbasat, 1991], and the role of experience [Venkatesh et al., 2003,pp. 433-435, 447]. More specifically, Cohen and Levinthal [1989] found that human and knowledge capital are key determinants for a firm's ability to assess technological opportunities and adopt ICT, while Brynjolfsson and Hitt [2002] state that knowledge-intensive firms tend to be more eager IT adopters. The case for the adoption of OSS can be further strengthened by hypothesizing that knowledge-intensive industries are more likely to realize a significant-enough return on investment on open source technologies that will warrant their adoption. In other industries the costs of switching to open source and supporting non-mainstream technologies may be difficult to justify, and, therefore, such industries will be less likely to adopt OSS. Research Question 10 How is employee productivity affecting OSS adoption?
Open source software is often less polished than its proprietary alternatives; version proliferation and poor usability are two often-reported problems [Nichols and Twidale, 2003,Krishnamurthy, 2005,Viorres et al., 2007]. Highly-paid employees, like knowledge workers, may argue that the fit of the OSS [Thompson et al., 1991], the service quality it offers [DeLone and McLean, 2003], or the perceived behavioral control they have over it [Ajzen, 1991] is worse than that of its proprietary alternative. The key factors for resisting such change can be classified into people-oriented, system-oriented, and interaction theories [Jiang et al., 2000]. As the cost of the software used by highly productive workers forms a small percentage of their total employment cost and the software's quality reflects a lot on their productivity, spending on industry-standard proprietary software may be a rational decision. Consequently, we could expect that the relative advantage of OSS viewed as an innovation [Moore and Benbasat, 1991,Rogers, 2003] will be marginal. As an example, traders with seven figure incomes are unlikely to skimp on the operating system running on their PCs. Conversely, in Fortune 1000 companies with numerous but less productive employees adoption of cheaper though less polished OSS can offer significant cost advantages, and therefore management can easier mandate its use. For instance, we can easily imagine the cost savings associated with thousands of service desks running Linux and the Thunderbird mail client. Research Question 11 Is the choice between OSS and proprietary software a matter of principle?
The choices between open source and proprietary software have been mainly analyzed in the context of business strategies [West, 2003] and the software industry [Economides and Katsamakas, 2006]. Many open source adherents advocate the adoption of OSS on the basis of ideology [Gay, 2002], while opponents have cautioned against adoption by analyzing various risks [Mundie, 2001]. We thus examine whether OSS ideology and risks carry real weight, or whether companies will choose between OSS and proprietary software platforms in a rational and pragmatic manner looking for their best interest [Aupperle et al., 1985,Clarkson, 1995], irrespective of the software's license.
4 Methodology
We conducted our study by examining web server logs and using network probes to look for evidence of OSS adoption among the US Fortune 1000 companies. Focusing on the Fortune 1000 companies benefited our study in a number of ways. First, their large size means that such companies are likely to adopt innovations before smaller ones Davies, [1975,p. 118]. In addition, the Fortune 1000 companies cover most sectors of the US economy, while their activity forms a large part of it. In fact, their revenues amount to about 41.5% of the total US corporate revenues for 2007 [US Census Bureau, 2009] and about half (49.6%) of the total profits [Wolfram-Alpha, 2009]. Large firms are also more likely to be export-oriented or multinational thereby increasing the study's applicability to a global audience. Furthermore, their large size increases the visibility of their operations, and makes them more likely to appear in our study's browser software radar. Finally, our choice meant that for all the companies we could readily obtain relatively reliable financial data, a sectoral categorization, and an address of an operating web site, and thereby also a probable domain-name address their employees use when accessing the web. Our study's US and large company focus confines somewhat its wider applicability, but the limitation is offset by the data's reliability and the sample's homogeneity. To a large extent our method avoids the self-selection, recall, and pro-adopter biases [Rogers, 2003] that plague other studies [Jeyaraj et al., 2006]. With a questionnaire-based study it would be probable that companies with antiquated IT strategies and systems would fail to respond; the same could also be true for companies whose IT management formed a tactical or strategic advantage. Both factors introduce a self-selection bias. Furthermore, self-reports are unreliable thus adding a recall bias. Finally, case studies often focus on adopters introducing a pro-adopter bias. By collecting hard objective data from a predefined sample we avoid these pitfalls, at the expense however, of loosing the ability to select all the questions we might want to answer.4.1 Data Collection and Processing
We used a variety of techniques to obtain data about the software used on the companies' desktops and by their back-office operations. Due to the methods we used, we focused on three types of software in four distinct roles: the web browser (on the desktop), the web server (in the back-office), and the operating system on which the two are running (on the desktop and in the back-office). To determine the desktop operating system and web browser software used by each company we examined web server logs. We collected about 55GB of log files from three sources: our own servers (4.7 GB), servers of our personal contacts (11.6GB), and files we located in the wild through Google queries (33.8GB). In total the log files contained 278 million entries. Web servers record a log entry in a standardized format for every file they send to a web browser. For the purposes of our study the entry's important fields are the IP address, the date, and the client's software. As a first step we processed each entry to convert the (typically) numerical IP address, like 195.212.29.137 into a host name like blueice18n5.uk.ibm.com. We then went through all log entries looking for those where the last two parts of a client's hostname matched those of a Fortune 1000 company's web site address. For instance, the above host name would match IBM's web site address www.ibm.com. We identified 4.7 million records associated with Fortune 1000 companies. These requests included 16,705 unique machine signatures (an IP address, a browser, and an operating system triple). Finally, for each matching entry we examined the client software details to determine whether the web browser and the underlying operating system were proprietary or open source. As an example, the following client identification stringMozilla/5.0 (Windows; U; Windows NT 5.1; en-US; rv:1.9) Gecko/2008052906 Firefox/3.0corresponds to an open source browser (Firefox) running on a proprietary operating system (Microsoft Windows XP). We tabulated the results by company and year in a list specifying whether a company was found to use a proprietary or open source (or both) operating system or browser. To determine the web server used by each company we retrieved the company's top web page using the wget tool, and logged the HTTP protocol headers. One of those headers contains an identification string of the web server, which we used to establish whether the company used a proprietary or an open source product. To determine the operating system type we employed nmap, a network exploration and port scanning tool [Wolfgang, 2002]. Nmap works by sending specific network packets to the host, and analyzing minute accidental differences in the responses that can be traced back to the responding computer's operating system. It then matches those results against a database of 1503 (for the version 4.76 we used) so-called operating system fingerprints. The match is probabilistic in nature and can often fail.
Table 1: Industry Distribution in Log Data and Among Fortune 1000 Companies (%)
| Industries by SIC | For each year | For each year | Any entry | Population | ||||
| 2002-2008 | 2006-2008 | 2002-2009 | ||||||
| Agriculture, Forestry and Fishing | 0 | .0 | 0 | .0 | 0 | .0 | 0 | .2 |
| Construction | 0 | .0 | 0 | .7 | 0 | .6 | 1 | .8 |
| Finance, Insurance and Real Estate | 3 | .1 | 15 | .9 | 16 | .0 | 16 | .1 |
| Manufacturing | 59 | .4 | 40 | .3 | 38 | .5 | 37 | .7 |
| Mining | 3 | .1 | 2 | .2 | 2 | .9 | 3 | .6 |
| Public Administration | 0 | .0 | 0 | .4 | 0 | .2 | 0 | .1 |
| Retail Trade | 0 | .0 | 8 | .0 | 10 | .5 | 11 | .2 |
| Services | 21 | .9 | 15 | .9 | 13 | .9 | 11 | .3 |
| Transportations, Communications, | 12 | .5 | 12 | .3 | 12 | .6 | 13 | .0 |
| Electric Gas and Sanitary Services | ||||||||
| Wholesale Trade | 0 | .0 | 4 | .3 | 4 | .8 | 5 | .0 |
4.2 Threats to Validity
There are several threats to the validity of this study; many are associated with the data we employed for identifying companies using open source operating systems and browsers. The first problem concerns the small number of software systems we examine. A company may use hundreds of software systems for a variety of purposes, but we examine just four: the web browser, the web server, and their corresponding operating system hosts. We argue that these are ubiquitous and highly-visible systems, from which we can derive generalizable lessons for desktop applications and system software. Nevertheless, lessons from these systems cannot apply to specialized vertical applications, and this remains a limitation of our study. In addition, the time period we use for the research questions with a longitudinal component (Q1, Q2, Q3) is very small (three years). This was a result of balancing data quality against time coverage, as explained in Section 4.1. For this reason we do not perform any longitudinal regression analysis, and base our findings on statistically significant results obtained for each year. We determined the web browser and operating systems used in a company by looking at the log entries created during web browsing. However, the web server logs we collected form only a tiny fraction of a company's complete browsing activity. As detailed in Section 4.1, for all the Fortune-1000 companies we identified 4.7 million web page records; on average 4,668 requests per company. These requests included 16,705 unique machine signatures giving us an average of 16.7 uniquely-configured PCs per company. Therefore, our work shares the problems of any empirical study based on a small sample of field data. Other, less important, possible sources of error include the parallel presence of OSS and proprietary applications, the provenance of the logs we examined, web requests performed by a company's visitors, the mapping of numerical IP addresses into host names, doctored HTTP headers, and limitations of the fingerprinting technique we employed. A concern voiced by some of this work's reviewers is whether the use of a particular operating system or browser reflects a company's policy rather than choices of individual employees. For this reason studies of IT acceptance often distinguish between voluntary vs. mandatory contexts [Venkatesh et al., 2003] and stress the importance of employing a multilevel perspective. This criticism is justified, because we academics and researchers are blessed with virtually unlimited freedom regarding the choice, setup, and configuration of our computing infrastructure. However, the situation in industry is different. There, automated mass installations from a single stable configuration image, a severely constrained user ability to install new software, and rigidly enforced IT policies are the rule. In large listed companies externally imposed legal requirements and standards,2 the provision of a standard operating environment, and the imposition of change management procedures align the software used by a company's employees with its policies.5 Analysis and Findings
| ||||||||||||||||||||||||||||||||||||||||||||||||||||||||||||||||||||||||||||||||||||||||||||||||||||||||||||||||||||||||||||||||||||||||||||||||||||||||||||||||||||||||||||||||||||||||||||||||||||||||||||||||||||||||||||||||||||||||||||||||||||||||||||||||||||||||||||||||||||||||||||||||||||||||||||||||||||||||||||||||||||||||||||
| ||||||||||||||||||||||||||||||||||||||||||||||||||||||||||||||||||||||||||||||||||||||||||||||||||||||||||||||||||||||||||||||||||||||||||||||||||||||||||||||||||||||||||||||||||||||||||||||||||||||||||||||||||||||||||||||||||||||||||||||||||||||||||||||||||||||||||||||||||||||||||||
| ||||||||||||||||||||||||||||||||||||||||||||||||||||||||||||||||||||||||||||||||||||||||||||||||||||||||||||||||||||
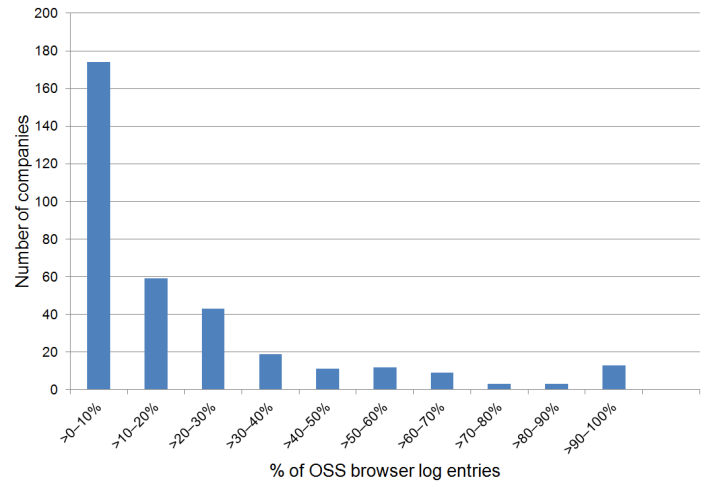
Table 5: Statistics Regarding Historical Data
| z-test | |||||
| Question | Sample | P(E2)(%) | P(E1)(%) | P(P(E2) > P(E1)) | |
| Q3 | 70 | 72 | 28 | 4 | .2488*** |
| Q2 | 401 | 79 | 21 | 18 | .4127*** |
Table 6: Number of OSS Applications Being Used per Year
| Year | t-test | |||||||||
| 2006(x) | 2007(y) | 2008(z) | (x, y) | (y, z) | ||||||
| All Companies | 0 | .68 | 0 | .89 | 1 | .01 | 3 | .54*** | 1 | .96* |
| Companies Already Using OSS | 1 | .28 | 1 | .26 | 1 | .31 | 0 | .41 | 1 | .13 |
|
Table 7: Statistical Results of Analysis on Contingency Tables
| Variables (OSS) | χ2 | p-value | Cramer's ϕ | |||
| Client OS — Server OS | 2 | .30 | 0 | .188 | 0 | .1198 |
| Browser — Server OS | 2 | .46 | 0 | .162 | 0 | .1241 |
| Browser — Web Server | 10 | .92 | 1 | .41×10−3** | 0 | .1605 |
| Client OS — Web Server | 16 | .47 | 8 | .44×10−5*** | 0 | .1971 |
| Client OS — Browser | 46 | .10 | 2 | .70×10−11*** | 0 | .3109 |
| Server OS — Web Server | 72 | .55 | 5 | .06×10−17*** | 0 | .4458 |
| Browser — More Than One | 99 | .12 | 2 | .37×10−23*** | 0 | .4606 |
| Client OS — More Than One | 157 | .28 | 4 | .43×10−36*** | 0 | .5794 |
| Server OS — More Than One | 158 | .21 | 2 | .78×10−36*** | 0 | .6561 |
| Web Server — More Than One | 297 | .40 | 1 | .21×10−66*** | 0 | .6857 |
| ||||||||||||||||||||||||||||||||||||||||||||||||||||||||||||||||||||||||||||||||||||||||||||||||||||||||||||||||||||||||||||||||||||||||||||||||||||||||||||||||||||||||||||||||||||||||||||||||||||||||||||||||
Table 9: Statistics of Adopting More Than One Application of the Same Type t
| Number of Known | P(∃i, j: t(ai) = t(aj)) | z-test | |||
| Applications a1...ak | Sample | n(%) | n > 50% | ||
| k | . | ||||
| OSS | At Least 2 | 446 | 51 | 0 | .8906 |
| At Least 3 | 353 | 55 | 2 | .4606* | |
| All Four | 119 | 63 | 3 | .3528*** | |
| Proprietary | At Least 2 | 668 | 94 | 83 | .0644*** |
| At Least 3 | 578 | 99 | 182 | .1667*** | |
| All Four | 354 | 100 | 369 | .3907*** | |
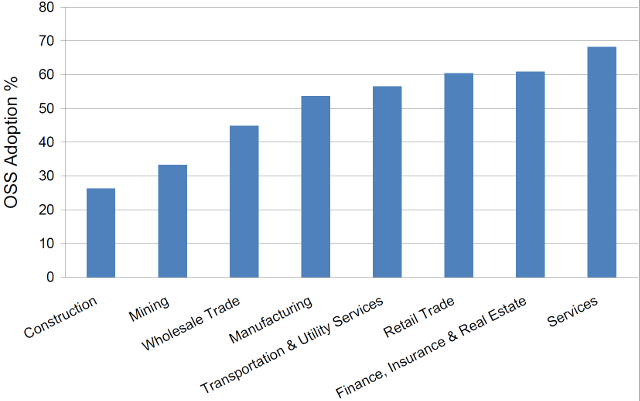
Table 10: Statistics on Adoption of Both OSS and Proprietary Software
| Number of Known | P(use both software types) | z-test | ||
| applications | Sample | n(%) | n > 50% | |
| At Least 2 | 692 | 60 | 10 | .6668*** |
| At Least 3 | 434 | 81 | 22 | .2601*** |
| All | 150 | 79 | 9 | .6187*** |
6 Discussion and Conclusions
Table 11: Company Examples Across Research Questions
| Level | Evidence of OSS Adoption | Example | |
| IT usage | High | Yes | PSS World Medical |
| intensity | Low | No | Newmont Mining Corporation |
| Knowledge | High | Yes | Travelers |
| intensity | Low | No | Target |
| Revenue per | High | No | Dow Chemical |
| employee | Low | Yes | MGM Mirage |
| Consumer | High | Yes | Starwood Hotels |
| focus | Low | No | Kiewit |
References
(All references to online material have been archived at WebCite.)- [Ajzen 1991]
- Ajzen, I., 1991. The theory of planned behavior. Organizational Behavior and Human Decision Processes 50, 179–211.
- [Attewell 1992]
- Attewell, P., 1992. Technology diffusion and organizational learning: The case of business computing. Organization Science 3, 1–19.
- [Aupperle et al. 1985]
- Aupperle, K.E., Carroll, A.B., Hatfield, J.D., 1985. An empirical examination of the relationship between corporate social responsibility and profitability. The Academy of Management Journal 28, 446–463.
- [Bayo-Moriones and Lera-López 2007]
- Bayo-Moriones, A., Lera-López, F., 2007. A firm-level analysis of determinants of ICT adoption in Spain. Technovation 27, 352–366.
- [Berlecon Research 2002]
- Berlecon Research, 2002. Free/libre open source software: Survey and study - use of open source software in firms and public institutions: Evidence from Germany, Sweden and UK.
- [Bessen 2002]
- Bessen, J., 2002. Technology adoption costs and productivity growth: The transition to information technology. Review of Economic Dynamics 5, 443–469.
- [Boehm and Turner 2004]
- Boehm, B., Turner, R., 2004. Balancing Agility and Discipline: A Guide for the Perplexed. Addison-Wesley, Boston, MA. chapter 2.
- [Brynjolfsson 1993]
- Brynjolfsson, E., 1993. The productivity paradox of information technology: Review and assessment. Communications of the ACM 35, 66–77.
- [Brynjolfsson and Yang 1996]
- Brynjolfsson, E., Yang, S., 1996. Information technology and productivity: A review of the literature, in: Zelkowitz, M. (Ed.), Advances in Computers. Academic Press. volume 43, pp. 179–214.
- [Brynjolfsson and Hitt 2002]
- Brynjolfsson, T.F.B.E., Hitt, L.M., 2002. Information technology, workplace organization, and the demand for skilled labor: Firm-level evidence. Quarterly Journal of Economics 117, 339–376.
- [Carr 2003]
- Carr, N.G., 2003. IT doesn't matter. Harvard Business Review , 41–49.
- [Casadesus-Masanell and Ghemawat 2006]
- Casadesus-Masanell, R., Ghemawat, P., 2006. Dynamic mixed duopoly: A model motivated by Linux vs. Windows. Management Science 52, 1072–1084.
- [Christensen and Rosenbloom 1995]
- Christensen, C.M., Rosenbloom, R.S., 1995. Explaining the attacker's advantage: Technological paradigms, organizational dynamics, and the value network. Research Policy 24, 233–257.
- [Church and Gandal 1992]
- Church, J., Gandal, N., 1992. Network effects, software provision, and standardization. The Journal of Industrial Economics 40, 85–103.
- [Clarkson 1995]
- Clarkson, M.B.E., 1995. A stakeholder framework for analyzing and evaluating corporate social performance. The Academy of Management Review 20, 92–117.
- [Coar 2006]
- Coar, K., 2006. The open source definition. Available online: http://www.opensource.org/docs/osd. Current July 2009.
- [Cohen and Levinthal 1989]
- Cohen, W.M., Levinthal, D.A., 1989. Innovation and learning: The two faces of R&D. The Economic Journal 99, 569–596.
- [Compeau and Higgins 1995]
- Compeau, D.R., Higgins, C.A., 1995. Computer self-efficacy: Development of a measure and initial test. MIS Quarterly 19, 189–211.
- [Cusumano 2004]
- Cusumano, M.A., 2004. The Business of Software: What Every Manager, Programmer, and Entrepreneur Must Know to Thrive and Survive in Good Times and Bad. The Free Press, New York.
- [Damanpour 1992]
- Damanpour, F., 1992. Organizational size and innovation. Organization Studies 13, 375–402.
- [Davies 1975]
- Davies, S., 1975. The Diffusion of Process Innovations. Cambridge University Press.
- [Davis 1989]
- Davis, F.D., 1989. Perceived usefulness, perceived ease of use, and user acceptance of information technology. MIS Quarterly 13, 319–340.
- [Dedrick and West 2003]
- Dedrick, J., West, J., 2003. Why firms adopt open source platforms: A grounded theory of innovation and standards adoption, in: MISQ Special Issue Workshop on Standard Making: A Critical Research Frontier for Information Systems, pp. 236–257.
- [DeLone 1981]
- DeLone, W.H., 1981. Firm size and the characteristics of computer use. MIS Quarterly 5, 65–77.
- [DeLone and McLean 2003]
- DeLone, W.H., McLean, E.R., 2003. The DeLone and McLean model of information systems success: A ten-year update. Journal of Management Information Systems 19, 9–30.
- [Deshpande and Riehle 2008]
- Deshpande, A., Riehle, D., 2008. The total growth of open source, in: 4th Conference on Open Source Systems (OSS 2008), pp. 197–209.
- [Dick and Basu 1994]
- Dick, A.S., Basu, K., 1994. Customer loyalty: Toward an integrated conceptual dramework. Journal of the Academy of Marketing Science 22, 99–113.
- [Dunne 1994]
- Dunne, T., 1994. Plant age and technology use in US manufacturing industries. Rand Journal of Economics 25, 488–499.
- [E-Soft Inc 2007]
- E-Soft Inc, 2007. Mail (MX) server survey. Available online: http://www.securityspace.com/s_survey/data/man.200701/mxsurvey.html. Current July 2009.
- [E-Soft Inc. 2009]
- E-Soft Inc., 2009. Web server survey. Available online: http://www.securityspace.com/s_survey/data/200902/index.html. Current March 2009.
- [Economides and Katsamakas 2006]
- Economides, N., Katsamakas, E., 2006. Two-sided competition of proprietary vs. open source technology platforms and the implications for the software industry. Management Science 52, 1057–1071.
- [Feller and Fitzgerald 2001]
- Feller, J., Fitzgerald, B., 2001. Understanding Open Source Software Development. Pearson Education, Harlow, UK. chapter 9.
- [Fichman 2000]
- Fichman, R.G., 2000. The diffusion and assimilation of information technology innovations, in: Zmud, R. (Ed.), Framing the Domains of It Management: Projecting the Future ... Through the Past. Pinnaflex Educational Resources, Cincinnati, OH, pp. 105–128.
- [Fichman and Kemerer 1993]
- Fichman, R.G., Kemerer, C.F., 1993. Adoption of software engineering process innovations: The case of object orientation. Sloan Management Review 34, 7–22.
- [Fichman and Kemerer 1999]
- Fichman, R.G., Kemerer, C.F., 1999. The illusory diffusion of innovation: An examination of assimilation gaps. Information Systems Research 10, 255–275.
- [Fitzgerald and Kenny 2004]
- Fitzgerald, B., Kenny, T., 2004. Open source software in the trenches: Lessons from a large-scale OSS implementation, in: 24th International Conference on Information Systems, pp. 316–326.
- [Forrester 2008]
- Forrester, 2008. Open source paves the way for the next generation of enterprise IT.
- [Gallaugher and Wang 2002]
- Gallaugher, J.M., Wang, Y.M., 2002. Understanding network effects in software markets: Evidence from web server pricing. MIS Quarterly 26, 303–327.
- [Gallivan 2001]
- Gallivan, M.J., 2001. Organizational adoption and assimilation of complex technological innovations: Development and application of a new framework. ACM SIGMIS Database 32, 51–85.
- [Gamma and Beck 2004]
- Gamma, E., Beck, K., 2004. Contributing to Eclipse: Principles, Patterns, and Plug-Ins. Addison-Wesley, Boston, MA.
- [Gay 2002]
- Gay, J. (Ed.), 2002. Free Software, Free Society: Selected Essays of Richard M. Stallman. GNU Press, Free Software Foundation, Boston.
- [Geiszler et al. 2004]
- Geiszler, D.A., Kent, J., Strahl, J.L.S., Cook, J., Love, G., Phegley, L., Schmidt, J., Zhao, Q., Franco, F., Frost, L., Frost, M., Grant, D., Lowder, S., Martinez, D., McDermid, L.N., 2004. The Navy's on-scene weather prediction system, COAMPS-OS, in: 20th Conference on Weather Analysis and Forecasting/16th Conference on Numerical Weather Prediction, American Meteorologival Society. p. 19.
- [Glynn et al. 2005]
- Glynn, E., Fitzgerald, B., Exton, C., 2005. Commercial adoption of open source software: An empirical study, in: International Symposium on Empirical Software Engineering, pp. 225–234.
- [Goldman and Gabriel 2005]
- Goldman, R., Gabriel, R.P., 2005. Innovation Happens Elsewhere: Open Source As Business Strategy. Morgan Kaufmann. chapter Licenses. pp. 111–136.
- [Gowrisankaran and Stavins 2004]
- Gowrisankaran, G., Stavins, J., 2004. Network externalities and technology adoption: Lessons from electronic payments. The RAND Journal of Economics 35, 260–276.
- [Gupta et al. 2008]
- Gupta, A., Hatter, J., Pinnoju, S., 2008. E*trade financial services. Journal of Business Case Studies 4.
- [Hannan and McDowell 1984]
- Hannan, T.H., McDowell, J.M., 1984. The determinants of technology adoption: The case of the banking firm. The RAND Journal of Economics 15, 328–335.
- [von Hippel 1998]
- von Hippel, E., 1998. Economics of product development by users: The impact of "sticky" local information. Management Science 44, 629–644.
- [Hitt and Brynjolfsson 1996]
- Hitt, L.M., Brynjolfsson, E., 1996. Productivity, business profitability, and consumer surplus: Three different measures of information technology value. MIS Quarterly 20, 121–142.
- [IDC 2001a]
- IDC, 2001a. Amazon.com migration from unix to Red Hat Linux. white paper.
- [IDC 2001b]
- IDC, 2001b. Toyota motor sales USA: Red Hat Linux across the enterprise. white paper.
- [IDC 2005]
- IDC, 2005. Western European software end-user survey.
- [Jeyaraj et al. 2006]
- Jeyaraj, A., Rottman, J.W., Lacity, M.C., 2006. A review of the predictors, linkages, and biases in IT innovation adoption research. Journal of Information Technology 21, 1–23.
- [Jiang et al. 2000]
- Jiang, J.J., Muhanna, W.A., Klein, G., 2000. User resistance and strategies for promoting acceptance across system types. Information & Management 37, 25–36.
- [Katz and Shapiro 1986]
- Katz, M.L., Shapiro, C., 1986. Technology adoption in the presence of network externalities. The Journal of Political Economy 94, 822–841.
- [Katz and Shapiro 1994]
- Katz, M.L., Shapiro, C., 1994. Systems competition and network effects. The Journal of Economic Perspectives 8, 93–115.
- [Kelley and Helper 1999]
- Kelley, M.R., Helper, S., 1999. Firm size and capabilities, regional agglomeration, and the adoption of new technology. Economics of Innovation and New Technology 8, 79–103.
- [Kerner 2007]
- Kerner, S., 2007. The trouble with BIND DNS servers. Available online: http://www.internetnews.com/security/article.php/3712251/. Current July 2009.
- [Kimberly and Evanisko 1981]
- Kimberly, J.R., Evanisko, M.J., 1981. Organizational innovation: The influence of individual, organizational, and contextual factors on hospital adoption of technological and administrative innovations. The Academy of Management Journal 24, 689–713.
- [King et al. 1994]
- King, J.L., Gurbaxani, V., Kraemer, K.L., McFarlan, F.W., Raman, K.S., Yap, C.S., 1994. Institutional factors in information technology innovation. Information Systems Research 5, 139–169.
- [King and Kraemer 1984]
- King, J.L., Kraemer, K.L., 1984. Evolution and organizational information systems: An assessment of Nolan's stage model. Communications of the ACM 27, 466–475.
- [Krishnamurthy 2005]
- Krishnamurthy, S., 2005. An analysis of open source business models, in: Feller, J., Fitzgerald, B., Hissam, S., Lakhani, K. (Eds.), Making sense of the bazaar: Perspectives on open source and free software. MIT Press, Cambridge, UK, pp. 279–298.
- [Kuan 2003]
- Kuan, J., 2003. Open source software as lead user's make or buy decision: A study of open and closed source quality, in: Second Conference on the Economics of the Software and Internet Industries.
- [Larsen et al. 2006]
- Larsen, M.H., Pedersen, M.K., Andersen, K.V., 2006. IT governance: Reviewing 17 IT governance tools and analysing the case of novozymes A/S. Hawaii International Conference on System Sciences 8, 195c.
- [Majumdar and Venkataraman 1998]
- Majumdar, S.K., Venkataraman, S., 1998. Network effects and the adoption of new technology: Evidence from the U.S. telecommunications industry. Strategic Management Journal 19, 1045–1062.
- [Matthews et al. 2008]
- Matthews, D., Wilson, G., Easterbrook, S., 2008. Configuration management for large-scale scientific computing at the UK met office. Computing in Science and Engineering 10, 56–64.
- [Messerschmitt and Szyperski 2004]
- Messerschmitt, D.G., Szyperski, C., 2004. Software Ecosystem: Understanding an Indispensable Technology and Industry. MIT Press, Cambridge, MA.
- [Moore and Benbasat 1991]
- Moore, G.C., Benbasat, I., 1991. Development of an instrument to measure the perceptions of adopting an information technology innovation. Information Systems Research 2, 192–222.
- [Morgan et al. 2006]
- Morgan, A., Colebournea, D., Thomas, B., 2006. The development of ICT advisors for SME businesses: An innovative approach. Technovation 26, 980–987.
- [Mundie 2001]
- Mundie, C., 2001. The commercial software model. Available online: http://www.microsoft.com/presspass/exec/craig/05–03sharedsource.mspx. Current July 2009. Speech Transcript — The New York University Stern School of Business.
- [Nagy et al. 2010]
- Nagy, D., Yassin, A.M., Bhattacherjee, A., 2010. Organizational adoption of open source software: Barriers and remedies. Commun. ACM 53, 148–151.
- [Netcraft Ltd 2001]
- Netcraft Ltd, 2001. Counting computers running the web. Available online: http://www.theregister.co.uk/2001/07/04/netcraft_posts_june_2001_web/. Current August 2009.
- [Netcraft Ltd 2009]
- Netcraft Ltd, 2009. February 2009 web server survey. Available online: http://news.netcraft.com/archives/2009/02/18/february_2009_web_server_survey.html. Current March 2009.
- [Nichols and Twidale 2003]
- Nichols, D.M., Twidale, M.B., 2003. The usability of open source software. First Monday 8.
- [Nolan 1973]
- Nolan, R.L., 1973. Managing the computer resource: A stage hypothesis. Communications of the ACM 16, 399–405.
- [Parker and Van Alstyne 2005]
- Parker, G.G., Van Alstyne, M.W., 2005. Two-sided network effects: A theory of information product design. Management Science 51, 1494–1504.
- [Prahalad and Hamel 1990]
- Prahalad, C.K., Hamel, G., 1990. Core competence of the corporation. Harvard Business Review 68.
- [Proctor et al. 2003]
- Proctor, P., Deusen, P.C., Heath, L.S., Gove, J.H., 2003. The open-source movement: An introduction for forestry professionals, in: 5th Annual Forest Inventory and Analysis Symposium, pp. 203–208.
- [Rogers 2003]
- Rogers, E.M., 2003. Diffusion of Innovations. Free Press. fifth edition.
- [Ross 2004]
- Ross, S.M., 2004. Introduction to Probability Models and Statistics for Engineers and Scientists, Third Edition. Academic Press. chapter 9. pp. 351–438.
- [Rossi et al. 2005]
- Rossi, B., Russo, B., Zuliani, P., Succi, G., 2005. On the transition to an open source solution for desktop office automation, in: Böhlen, M., Gamper, J., Polasek, W., A.Wimmer, M. (Eds.), E-Government: Towards Electronic Democracy, Springer Berlin / Heidelberg. pp. 277–285. Lecture Notes in Artificial Intelligence 3416.
- [Rubin et al. 2002]
- Rubin, H., Johnson, M., Iventosch, S., 2002. The US software industry. IEEE Software 19, 95–97.
- [Saloner and Shepard 1995]
- Saloner, G., Shepard, A., 1995. Adoption of technologies with network effects: An empirical examination of the adoption of automated teller machines. The RAND Journal of Economics 26, 479–501.
- [Samuelson 2006]
- Samuelson, P., 2006. IBM's pragmatic embrace of open source. Communications of the ACM 49, 21–25.
- [Searls 2003]
- Searls, D., 2003. Linux makes wi-fi happen in new york city. Linux Journal 2003, 3.
- [Searls 2004]
- Searls, D., 2004. DIY-IT: How Linux and open source are bringing do-it-yourself to information technology. Linux Journal 2004, 4.
- [Shapiro and Varian 1999]
- Shapiro, C., Varian, H.R., 1999. Information Rules: A Strategic Guide to the Network Economy. Harvard Business School Press, Boston.
- [Simpson and Bekman 2007]
- Simpson, K., Bekman, S., 2007. Fingerprinting the world's mail servers. Available online: http://www.oreillynet.com/pub/a/sysadmin/2007/01/05/fingerprinting-mail-servers.html. Current July 2009.
- [Sorensen and Stuart 2000]
- Sorensen, J.B., Stuart, T.E., 2000. Aging, obsolescence, and organizational innovation. Administrative Science Quarterly 45, 81–112.
- [Spanos et al. 2002]
- Spanos, Y.E., Prastacos, G.P., Poulymenakou, A., 2002. The relationship between information and communication technologies adoption and management. Information and Management 39, 659–675.
- [Spinellis 2003]
- Spinellis, D., 2003. Code Reading: The Open Source Perspective. Addison-Wesley, Boston, MA.
- [Spinellis 2006]
- Spinellis, D., 2006. Code Quality: The Open Source Perspective. Addison-Wesley, Boston, MA.
- [Stiroh 2001]
- Stiroh, K.J., 2001. Investing in information technology: Productivity payoffs for U.S. industries. Current Issues in Economics and Finance 7.
- [Stiroh 2002]
- Stiroh, K.J., 2002. Information technology and the U.S. productivity revival: What do the industry data say? The American Economic Review 92, 1559–1576.
- [Stoneman 1981]
- Stoneman, P., 1981. Intra-firm diffusion, bayesian learning and profitability. The Economic Journal 91, 375–388.
- [Stoneman and Kwon 1996]
- Stoneman, P., Kwon, M.J., 1996. Technology adoption and firm profitability. The Economic Journal 106, 952–962.
- [The Dravis Group 2003]
- The Dravis Group, 2003. Open source software: Case studies examining its use.
- [The Economist ]
- The Economist, 2001. An open and shut case: What is behind Microsoft's attack on open-source software? The Economist .
- [Thompson et al. 1991]
- Thompson, R.L., Higgins, C.A., Howell, J.M., 1991. Personal computing: Toward a conceptual model of utilization. MIS Quarterly 15, 125–143.
- [Tornatzky and Klein 1982]
- Tornatzky, L., Klein, K., 1982. Innovation characteristics and innovation adoption-implementation: A meta-analysis of findings. IEEE Transactions on Engineering Management 29, 28–45.
- [Unisphere Research 2006]
- Unisphere Research, 2006. IBM open source and LinuxLine survey.
- [UNU-MERIT 2006]
- UNU-MERIT, 2006. Study on the economic impact of open source software on innovation and the competitiveness of the information and communication technologies (ICT) sector in the EU.
- [US Census Bureau 2009]
- US Census Bureau, 2009. 2007 economic census, core business statistics. Available online: http://factfinder.census.gov/servlet/DatasetMainPageServlet?_program=ECN&_submenuId=datasets_4&_lang=en. Current June 2009.
- [Ven and Verelst 2006]
- Ven, K., Verelst, J., 2006. The organizational adoption of open source server software by belgian organizations, in: Open Source Systems. Springer, Boston. volume 203, pp. 111–122.
- [Venkatesh et al. 2003]
- Venkatesh, V., Morris, M.G., Davis, G.B., Davis, F.D., 2003. User acceptance of information technology: Toward a unified view. MIS Quarterly 27, 425–478.
- [Viorres et al. 2007]
- Viorres, N., Xenofon, P., Stavrakis, M., Vlachogiannis, E., Koutsabasis, P., Darzentas, J., 2007. Major HCI challenges for open source software adoption and development, in: Online Communities and Social Computing. Springer Verlag, pp. 455–464. Lecture Notes in Computer Science 4564.
- [von Hippel 1988]
- von Hippel, E., 1988. The Sources of Innovation. Oxford University Press, New York.
- [von Hippel 2001]
- von Hippel, E., 2001. Innovation by user communities: Learning from open source software. Sloan Management Review 42, 82–86.
- [Voth 2003]
- Voth, D., 2003. Open source in the US government. IEEE Software 20, 73.
- [Walli et al. 2005]
- Walli, S., Gynn, D., von Rotz, B., 2005. The growth of open source software in organizations.
- [Wang and Wang 2001]
- Wang, H., Wang, C., 2001. Open source software adoption: A status report. IEEE Software 18, 90–95.
- [Weber 2005]
- Weber, S., 2005. The Success of Open Source. Harvard University Press.
- [von Weizsacker 1984]
- von Weizsacker, C.C., 1984. The costs of substitution. Econometrica 52, 1085–1116.
- [West 2003]
- West, J., 2003. How open is open enough?: Melding proprietary and open source platform strategies. Research Policy 32, 1259–1285.
- [West and Dedrick 2001]
- West, J., Dedrick, J., 2001. Open source standardization: The rise of linux in the network era. Knowledge, Technology and Policy 14, 88–112.
- [Wheeler 2007]
- Wheeler, D.A., 2007. Why open source software / free software (OSS/FS, FLOSS, or FOSS)? look at the numbers! Available online: http://www.dwheeler.com/oss_fs_why.html. Current March 2009.
- [Wolff 2006]
- Wolff, E., 2006. The growth of information workers in the US economy, 1950–2000: The role of technological change, computerization, and structural change. Economic Systems Research 18, 221–255.
- [Wolfgang 2002]
- Wolfgang, M., 2002. Host Discovery with nmap. Available online http://moonpie.org/writings/discovery.pdf. Current February 2009.
- [Wolfram-Alpha 2009]
- Wolfram-Alpha, 2009. "total US company profits 2007" query. Available online: http://www08.wolframalpha.com/input/?i=total+us+company+profits+2007. Current July 2009.
- [Woods and Guliani 2005]
- Woods, D., Guliani, G., 2005. Open Source for the Enterprise: Managing Risks, Reaping Rewards. O'Reilly Media, Incorporated.
- [Yang and Jiang 2007]
- Yang, Z., Jiang, M., 2007. Using Eclipse as a tool-integration platform for software development. IEEE Software 24, 87–89.
- [Zahra and Covin 1993]
- Zahra, S.A., Covin, J.G., 1993. Business strategy, technology policy and firm performance. Strategic Management Journal 14, 451–478.
Revision: 1.246